

Metrics are a fundamental pillar of observability. There comes a time when it becomes extremely important to monitor your application's metrics, either to help diagnose possible problems, analyze how users are interacting with your application, or simply to have visibility into how the resources in your app are allocated.
The good news is that the Elixir and Phoenix ecosystem is well prepared to help you with this kind of observability. Many libraries already emit telemetry events using a consistent interface based on Telemetry and Telemetry Metrics. All you have to do is set up a reporter to start aggregating and processing these data.
In this blog, we’ll show you how to use PromEx together with Prometheus to aggregate your app’s metrics. Then we’ll walk through how to use PromEx to automate your Grafana dashboards and make observability as simple as possible.
In part 2 of this post, we’ll explore creating your own PromEx plugins to gather and visualize the exact metrics you want to see from your app.
Prometheus Metrics
Prometheus is a popular open-source project created to collect and store real-time metrics from applications. As described on its official GitHub page, "It collects metrics from configured targets at given intervals, evaluates rule expressions, displays the results, and can trigger alerts when specified conditions are observed”.
Prometheus uses an HTTP pull model to get metrics from the apps you want to monitor. As long as the app exposes an HTTP metric endpoint, Prometheus can query it periodically. These metrics normally include a wide variety of information, like system resources, query times, HTTP response status, latency, and many other aspects relevant to understanding system behavior and performance.
Grafana Dashboards
Grafana is an open-source data visualization and monitoring tool that allows users to query, visualize, and analyze data from various sources. It provides a highly customizable and interactive platform for creating dashboards and displaying real-time metrics, analytics, and alerts.
Why Prometheus Metrics and Grafana Dashboards
By using Prometheus and Grafana together, you have a great combo for monitoring and visualizing your application data. Prometheus is excellent for its efficient data collection and storage, and Grafana is great for interactive and rich data visualization. This combination empowers you to monitor, analyze, and troubleshoot your system effectively, enabling you to make data-driven decisions and optimize performance.
The PromEx Library
PromEx is a library made by Alexander Koutmos that helps you integrate your Elixir application with Prometheus and Grafana. It provides a setup for you to start aggregating and exposing Prometheus metrics and it also uses the Grafana Dashboard API to automate the creation of Grafana dashboards. PromEx is easy to use: as described on its GitHub page, "PromEx provides a ‘Plug-in’ style library where you can easily add new plug-ins to surface metrics so that Prometheus can scrape them.”
For example, by just choosing to use the plugin for Oban (PromEx.Plugins.Oban), you have the
Oban event metrics available to Prometheus and also have some Grafana
dashboards created for you at the application startup. You can see the list of
available built-in plugins on the project Github page.
Using PromEx, Prometheus, and Grafana
Let’s create a new Phoenix app to illustrate the installation and configuration of PromEx. You can also try this on your existing Phoenix project.
We’ll also set up Prometheus and Grafana in our local environment to see them handle the application metrics. Finally, we’ll set up Prometheus and Grafana in our local environment to see all three systems working together.
First, create your new app.
mix phx.new my_app --install
Then configure your database in config/dev.exs and run the Ecto command in your project folder:
mix ecto.create
Configure Your Phoenix Application
Add the PromEx dependency to your application:
def deps do
  [
    {:prom_ex, "~> 1.8.0"}
  ]
end
Fetch the prom_ex dependency by running the following command in the terminal:
mix deps.get
And run:
mix prom_ex.gen.config --datasource YOUR_PROMETHEUS_DATASOURCE_ID
No need to worry if you don't have YOUR_PROMETHEUS_DATASOURCE_ID set yet, as we will be doing this later in Grafana.
So we can temporarily have any value here and easily update it later.
This command will create the module MyApp.PromEx with the instructions to finish setting up PromEx. It’s very
important to follow the instructions carefully. There are four basic steps:
- Update your configuration (
config.exs,dev.exs,prod.exs,releases.exs, etc.) with the given PromEx config - Add the
MyApp.PromExmodule to your application supervision tree - Update your
endpoint.exfile to expose your metrics - Choose which plugins and dashboards you want to use (you don’t need to do this step right now, as we will be revisiting it later)
Once again, follow the instructions written in the newly created file carefully to understand the reasoning behind each step.
Let’s start the Phoenix server:
mix phx.server
If the installation worked, you will already be able to see some metrics by hitting the /metrics endpoint:
localhost:4000/metrics
Now that your application's metrics are accessible through an endpoint, the next step involves running and configuring Prometheus to ingest this data.
Running Prometheus
You can run Prometheus one of three ways: using the Homebrew package, installing the official Docker image (see below), or installing it from source by following the "getting started” steps of their official install guide (you’re on your own for this one).
Running Prometheus with Homebrew:
brew install prometheus
Please take note of the installation location, as you will need to update a configuration file accordingly.
If you installed it locally, you’ll have to update the prometheus.yml file the installation created. Just edit the
file by adding the phoenix_app job definition to the scrape_configs section:
- job_name: 'phoenix_app'
Override the global default and scrape targets from this job every 5 seconds.
scrape_interval: 5s
static_configs:
- targets: ['localhost:4000']
You have to restart your Prometheus instance if it was already running.
brew services restart prometheus
Running Prometheus with Docker
You can also run it with Docker, but regardless of the way you choose, we have to configure Prometheus to scrape your app.
To run it with Docker, first we have to create the prometheus.yml config file. We’ll use a simple example for this
tutorial that you can test in your localhost:
touch prometheus.yml
Open the newly created file and paste the following settings:
global:
scrape_interval: 15s # By default, scrape targets every 15 seconds.
A scrape configuration containing the endpoints to scrape:
scrape_configs:
- job_name: 'prometheus'
static_configs:
- targets: ['host.docker.internal:9090']

- job_name: 'phoenix_app'
Override the global default and scrape targets from this job every 5 seconds.
scrape_interval: 5s
static_configs:
- targets: ['host.docker.internal:4000']
Once you’ve created the prometheus.yml file, you can point to it using the following Docker command (make sure you
replace "~/my_app/prometheus.yml" with the correct path of your own prometheus.yml file):
docker run \
-p 9090:9090 \
-v ~/my_app/prometheus.yml:/etc/prometheus/prometheus.yml \
prom/prometheus
Note: host.docker.internal was used in the prometheus.yml file so the container can connect to a service on the
host. This special DNS name works if you are using Docker Desktop. If you are running Docker for Linux, replace
['host.docker.internal:4000'] with ['localhost:4000'] and run this instead:
docker run --network=host \
-p 9090:9090 \
-v ~/my_app/prometheus.yml:/etc/prometheus/prometheus.yml \
prom/prometheus
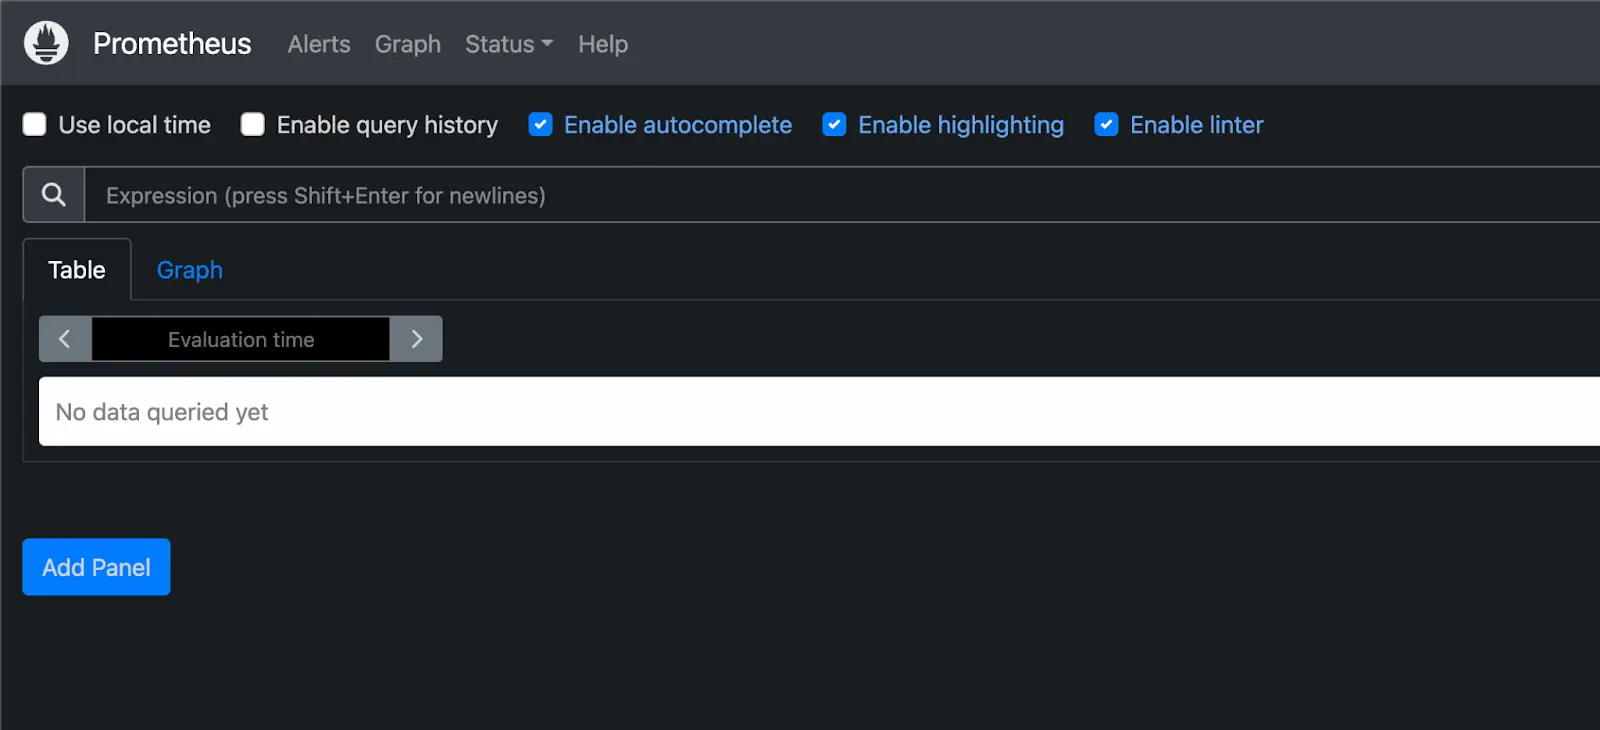
To verify if Prometheus is running properly, navigate to localhost:9090 in your web browser, and you should then be
presented with this screen:
Ensure that your Phoenix server is running, and then click on "Status" followed by "Targets" (or you can directly navigate to http://localhost:9090/targets).
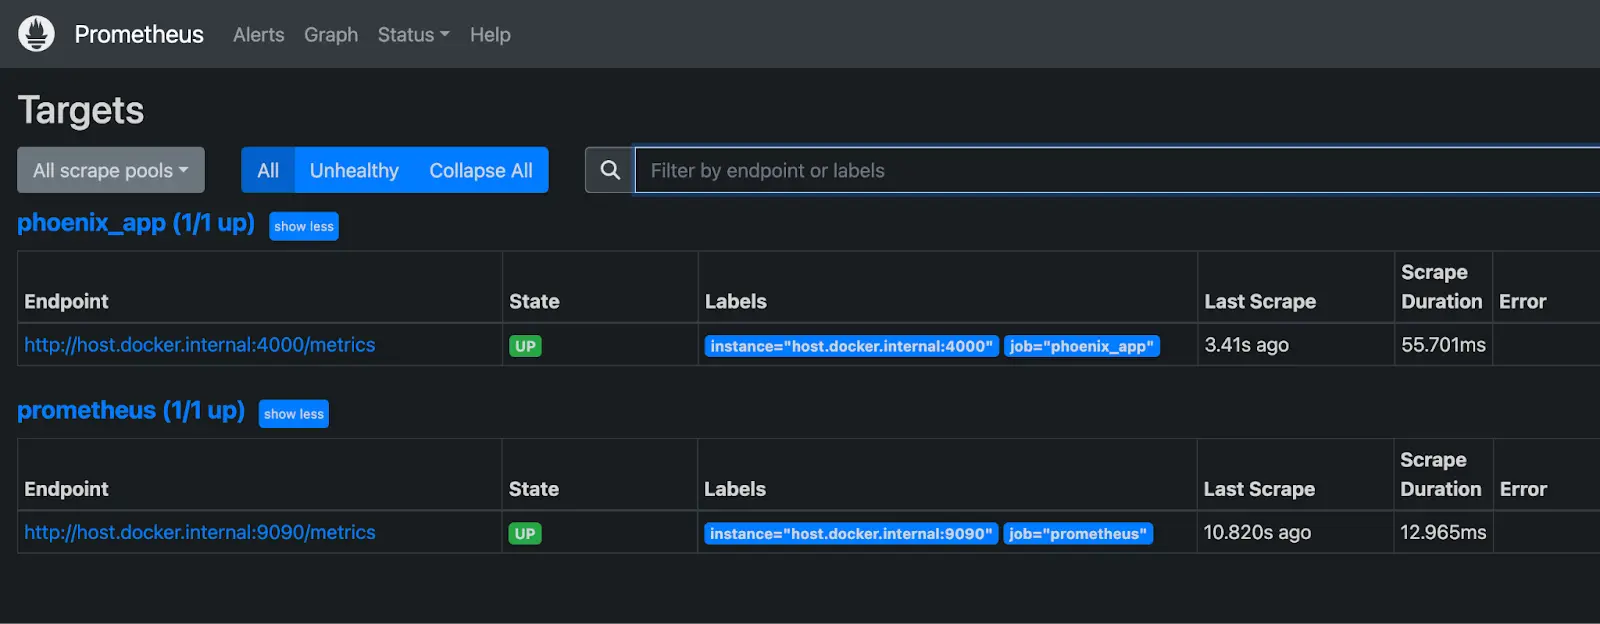
If the State is UP for the job phoenix_app, it means that Prometheus is already running correctly and configured to
scrape the metrics of your application.
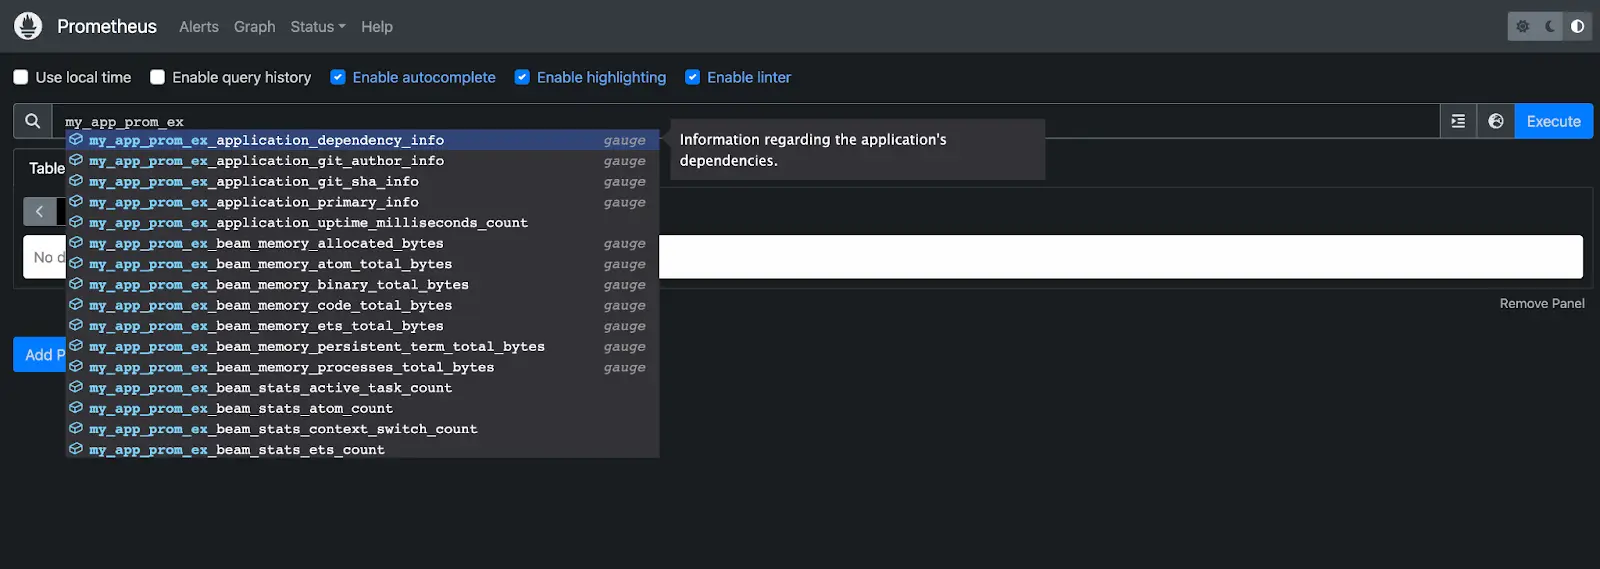
Let’s specify a metric from your Phoenix app inside the Prometheus dashboard. Navigate to
http://localhost:9090 again and start typing my_app_prom_ex inside the search input. You
should see a list of available metrics:
(remember to replace my_app prefix with your app name)
Choose a metric from the list (try locating: my_app_prom_ex_beam_memory_allocated_bytes) and click on the "Execute"
button to proceed.
You can also change the tab to Graph:
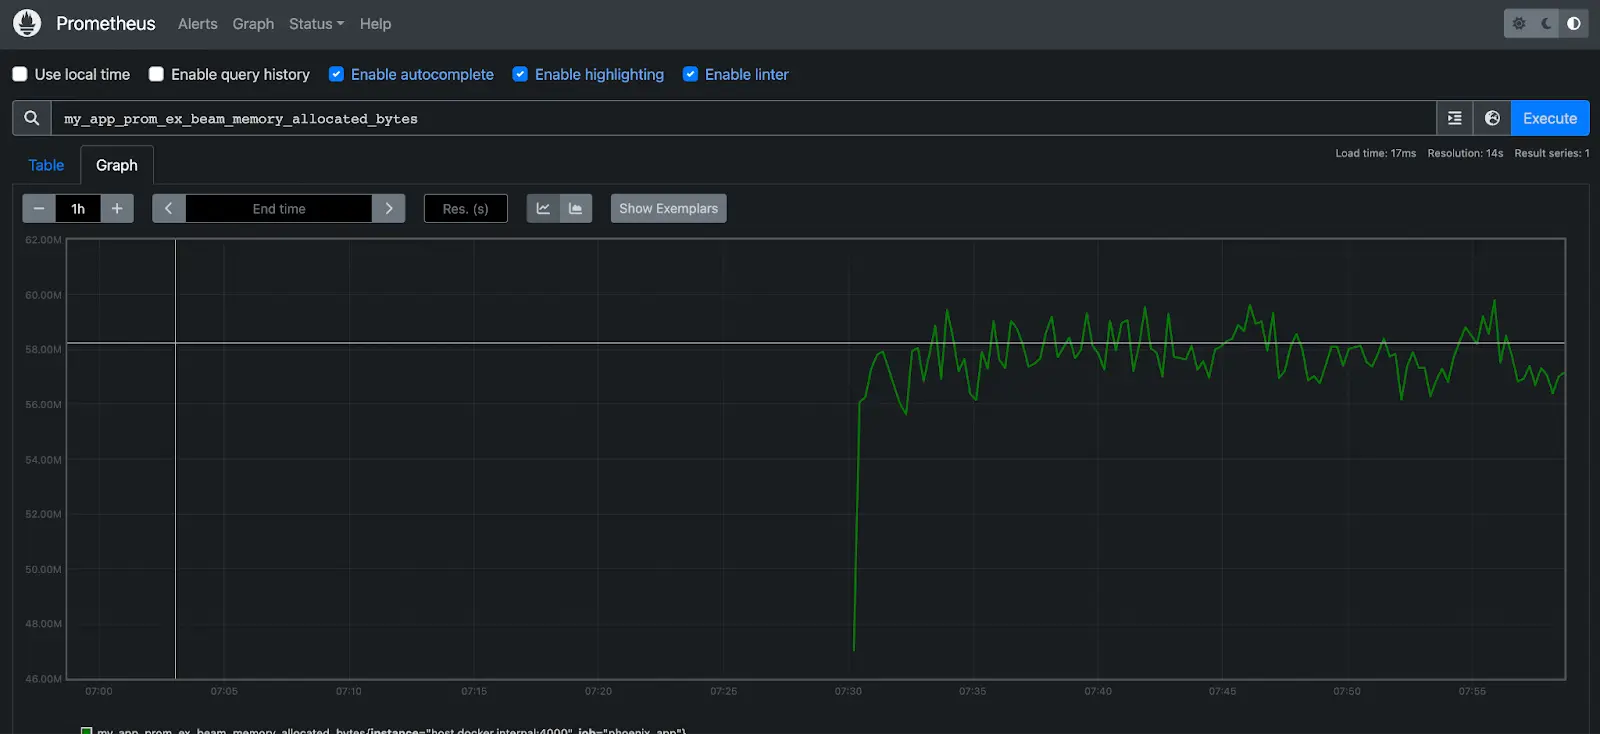
The beam_memory_allocated_bytes metric should be accessible as PromEx includes a built-in plugin specifically designed
to capture metrics related to the Erlang Virtual Machine (BEAM). Open the MyApp.PromEx module again and you should
find it listed among the available plugins (Plugins.Beam). If it appears as a comment, ensure that you have
uncommented it to make the metric accessible.
def plugins do
  [
    # PromEx built in plugins
    Plugins.Application,
    Plugins.Beam
    # {Plugins.Phoenix, router: MyAppWeb.Router, endpoint: MyAppWeb.Endpoint},
    # Plugins.Ecto,
    # Plugins.Oban,
    # Plugins.PhoenixLiveView,
    # Plugins.Absinthe,
    # Plugins.Broadway,

    # Add your own PromEx metrics plugins
    # MyApp.Users.PromExPlugin
  ]
end
Let's uncomment the built-in plugin for Phoenix (Plugins.Phoenix) and restart the server. Afterward, revisit the
Prometheus dashboard and enter my_app_prom_ex_phoenix in the search input. Now, you should be able to view metrics
specifically related to Phoenix.
As described on the PromEx GitHub page, "The goal of this project is to provide a "Plug-in" style library where you can easily add new plug-ins to surface metrics so that Prometheus can scrape them.” So you can see that with this design, it becomes very easy to add new plugins to your project.
In addition to the plugins function, the MyApp.PromEx module also includes the dashboards function. Now, let's
proceed with the installation of Grafana and explore how to enable these dashboards.
Running Grafana:
You can install Grafana locally either by following the official instructions, with Homebrew, or by running it in a Docker container.
Brew
brew install grafana

brew services start grafana
Docker
docker run -p 3000:3000 grafana/grafana-enterprise
You can check if it’s running correctly by going to localhost:3000 (use admin/admin as the credentials to login).
Now we can configure our Phoenix project so that PromEx starts communicating with Grafana. Let’s go back to the
configuration file which you configured earlier (config.exs or dev.exs), and update the grafana option:
Replace:
config :my_app, MyApp.PromEx,
...
grafana: :disabled,
...
With:
config :my_app, MyApp.PromEx,
...
grafana: [
  host: "http://localhost:3000",
  # Authenticate via Basic Auth
  username: "admin",
  password: "admin",
  upload_dashboards_on_start: true
],
...
Remember to put your own credentials if you changed your password when logging into Grafana for the first time. You can check more detailed information about those configs in PromEx.Config.
Restart your Phoenix server and you should be able to see the option we set upload_dashboards_on_start: true taking
place:
my_app % mix phx.server
Generated my_app app

[info] PromEx.DashboardUploader successfully uploaded my_app/_build/dev/lib/prom_ex/priv/application.json.eex to
Grafana.

[info] PromEx.DashboardUploader successfully uploaded my_app/_build/dev/lib/prom_ex/priv/beam.json.eex to Grafana.

[info] Running MyAppWeb.Endpoint with cowboy 2.10.0 at 127.0.0.1:4000 (http)
As you can see in the logged message, some of the PromEx built-in dashboards have been uploaded to Grafana. To access these newly created dashboards, simply navigate to the Dashboards menu in Grafana by visiting http://localhost:3000/dashboards.
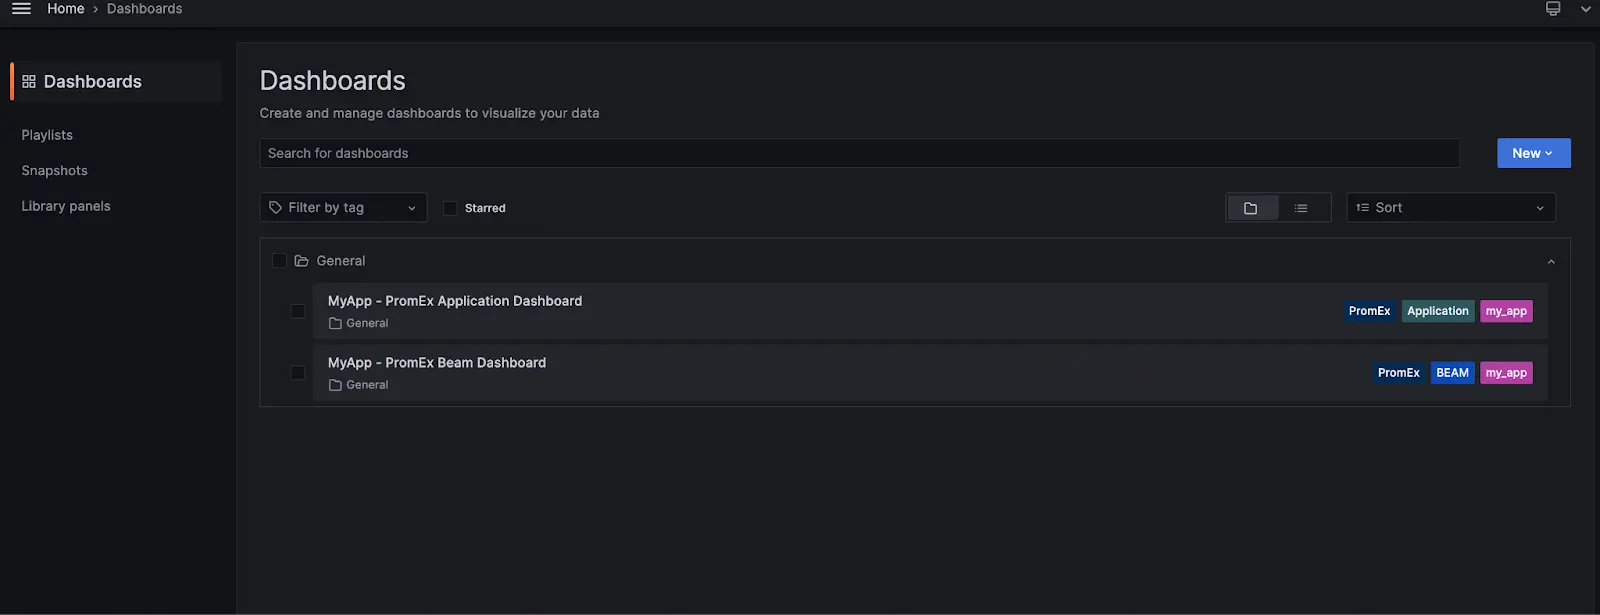
You will see these 2 dashboards created: PromEx Application Dashboard PromEx Beam Dashboard
The reason for this is that currently we only have two dashboards configured in the MyApp.PromEx module.
def dashboards do
  [
    # PromEx built in Grafana dashboards
    {:prom_ex, "application.json"},
    {:prom_ex, "beam.json"}
    # {:prom_ex, "phoenix.json"},
    # {:prom_ex, "ecto.json"},
    # {:prom_ex, "oban.json"},
    # {:prom_ex, "phoenix_live_view.json"},
    # {:prom_ex, "absinthe.json"},
    # {:prom_ex, "broadway.json"},

    # Add your dashboard definitions here with the format: {:otp_app, "path_in_priv"}
    # {:my_app, "/grafana_dashboards/user_metrics.json"}
  ]
end
To have both Phoenix and Ecto entries listed in the Dashboards menu on Grafana, uncomment their respective entries in the configuration file. Afterward, restart your server, and you will be able to see them in the Dashboards menu in Grafana as well.
This confirms that the communication between your Phoenix app and Grafana is working correctly. However, upon clicking any of the available dashboards, you will observe a page similar to the following:

While the layout of the dashboards has been created in Grafana, the dashboards themselves are not yet populated with data. This is because we have not yet established the communication between Grafana and Prometheus, preventing the dashboards from being populated.
To make this work, all you need to do is configure a data source in Grafana. It's a simple step that will enable the integration between the two tools: Go to the data sources menu on Grafana (http://localhost:3000/datasources) Click on the "Add data source" button. From the list of available data sources, select "Prometheus".
For this simple tutorial, all we need to set are the data source name and the URL:
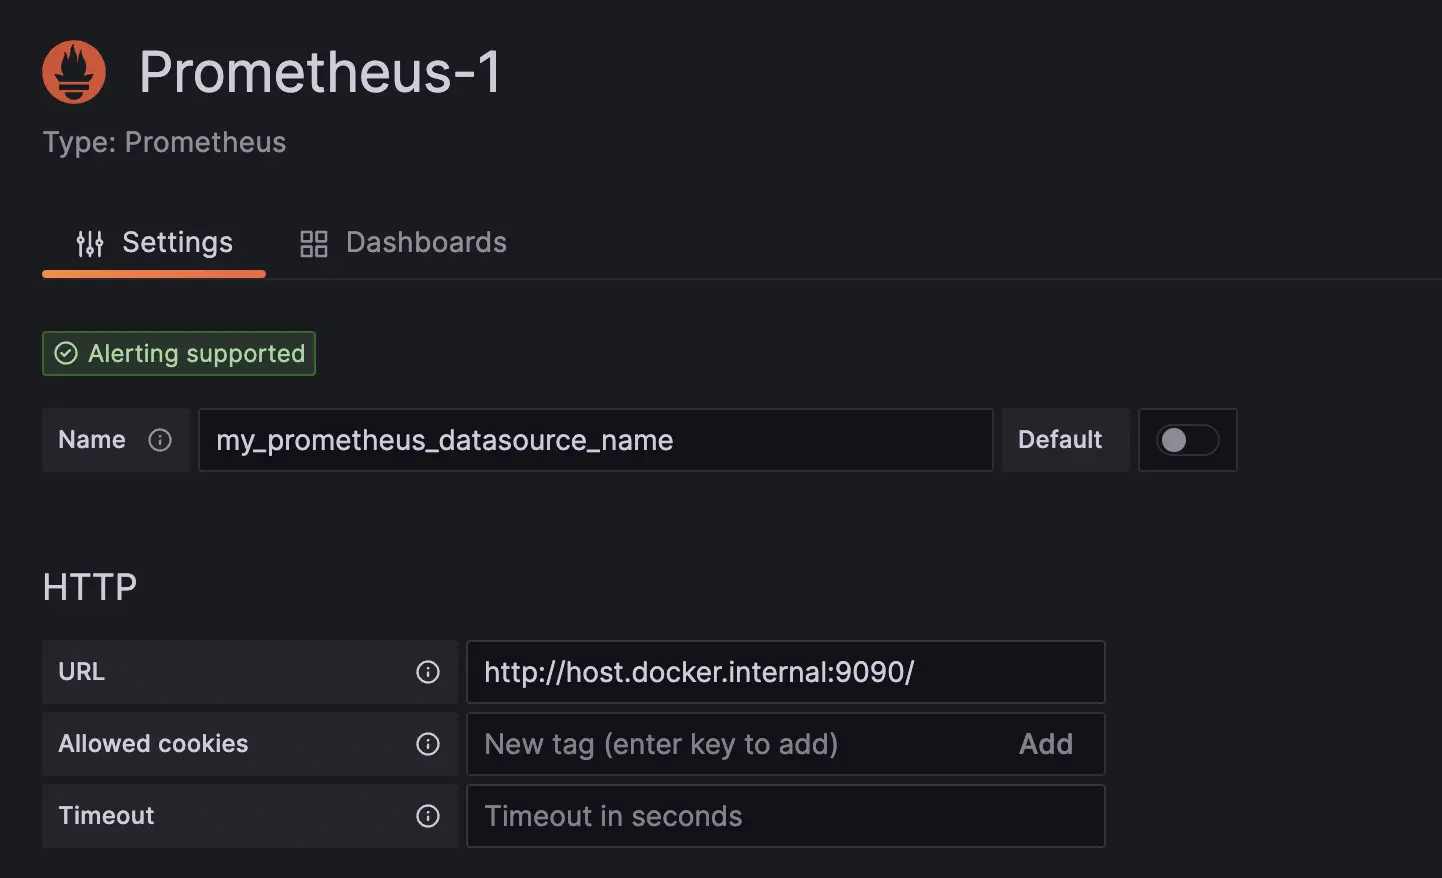
The URL should point to your Prometheus instance. In my case, I'm utilizing http://host.docker.internal:9090/ as I'm running Prometheus and Grafana through Docker Desktop. However, if you have them running locally, you can simply use http://localhost:9090/.
Click on the "Save & Test" button located at the bottom of the page, and you should receive a confirmation message stating "data source is working."
Now, for the final step, you need to take the name you entered and use it as the datasource_id in the PromEx
configuration file.
Open the MyApp.PromEx module and update the datasource_id:
def dashboard_assigns do
  [
    datasource_id: "my_prometheus_datasource_name",
    default_selected_interval: "30s"
  ]
end
Restart your Phoenix server, go back to the Dashboards page, and start browsing the available dashboards.
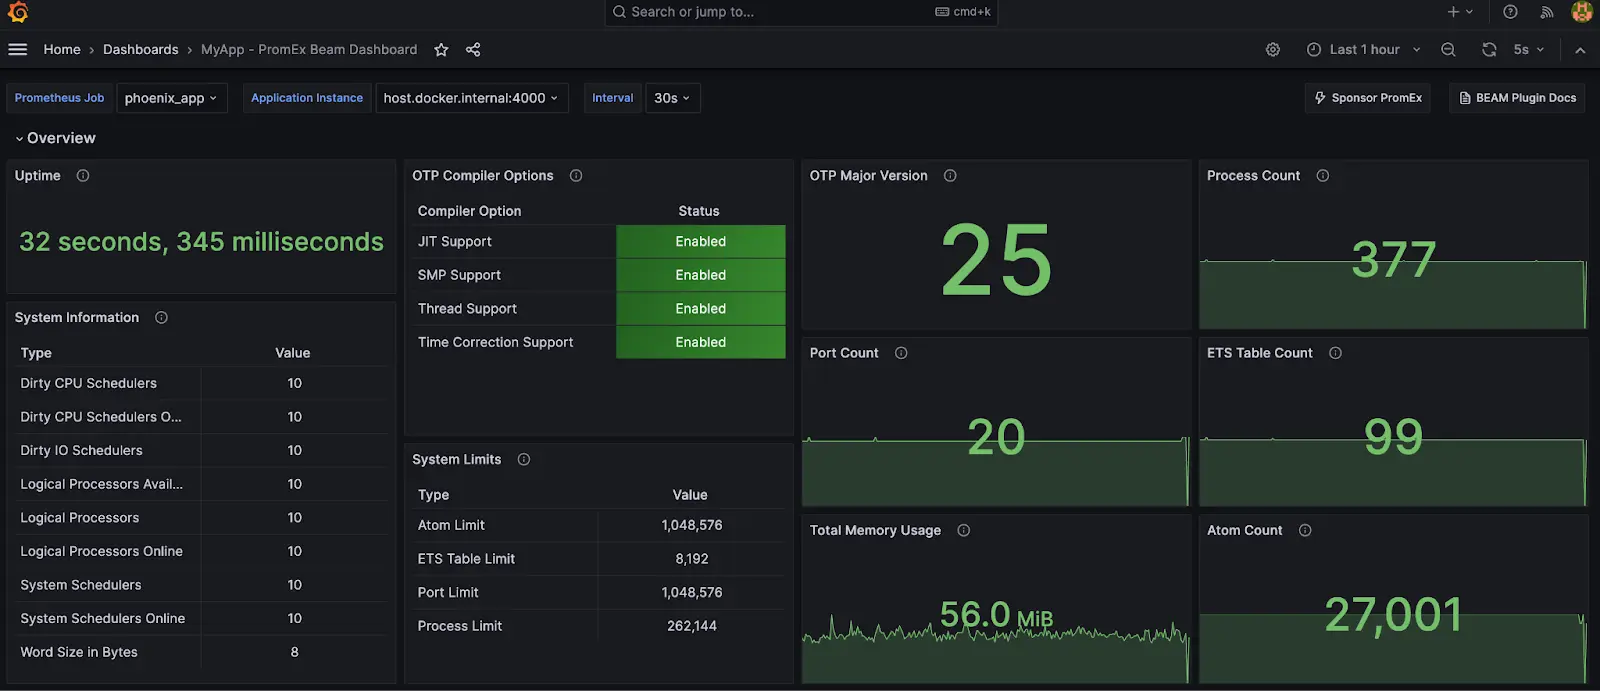
They will be populated with metrics collected by Prometheus 🎉.
Wrapping Up
Now that we have access to the built-in metrics and dashboards from popular libraries, maybe we also want to start exploring building our own plugins to be able to start collecting metrics that are specific and relevant to our application. You can dig into Part 2 to discover more about this!
